Active Directory Audit Policy and Log Collection

As a security analyst, Windows event logs are among the most valuable sources of information for your daily work. Optimizing the logging of critical activities within an Active Directory environment or even a single workstation is crucial. It not only accelerates incident detection but also provides a robust source of evidence in the event of a network intrusion.
In this blog post, part of the Active Directory Exploitation and Security Monitoring series, we’ll focus on setting up comprehensive event logging in an Active Directory environment using Group Policy Object (GPO) and ingesting event logs into elasticsearch with Winlogbeat agent. For optimal logging practices, be sure to check out Microsoft audit recommendation
Active Directory Audit Policy with GPO
Group Policy Object (GPO) can be used to centrally applied a comprehensive audit policy in a corporate environment like in our lab setup. Per Microsoft audit guide, we will proceed with the configuration one DC01 - kingslanding:
- Open the Group Policy Object Management Tools
- Launch the
Group Policy Object Managementand go to Forest:sevenkingdoms.local -> Domains -> sevenkingdoms.local -> Group Policy Objects to view existing GPOs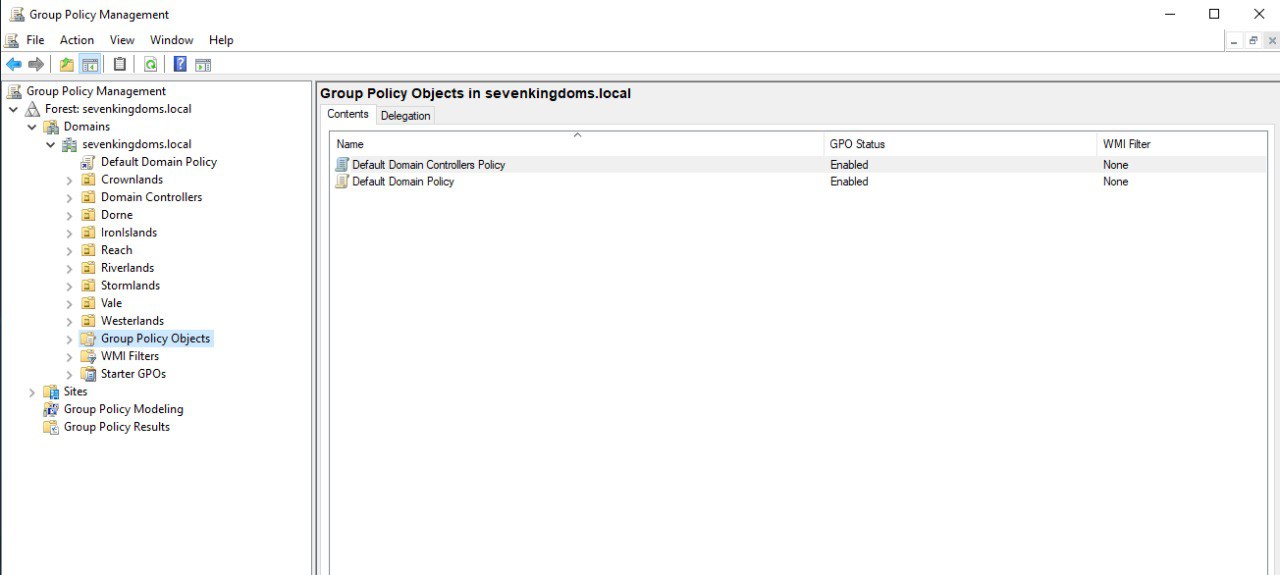
- Launch the
- Create a new GPOs for Windows event logging
- Right-click and select New to create a new audit policy to configure the logging
- Configure the Audit Policy
- After creating the new GPOs, named
Windows Events Logging, right-click and select Edit to open Group Policy Management Editor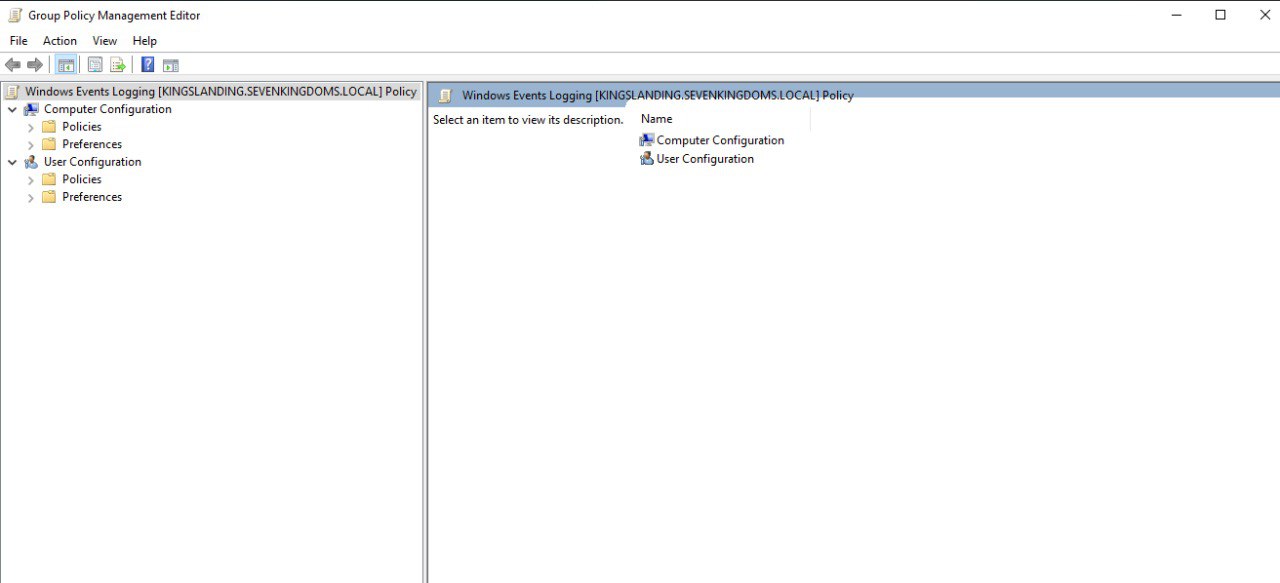
- Go to Computer Configuration -> Policies -> Windows Settings -> Security Settings -> Advanced Audit Policy Configuration -> Audit Policies
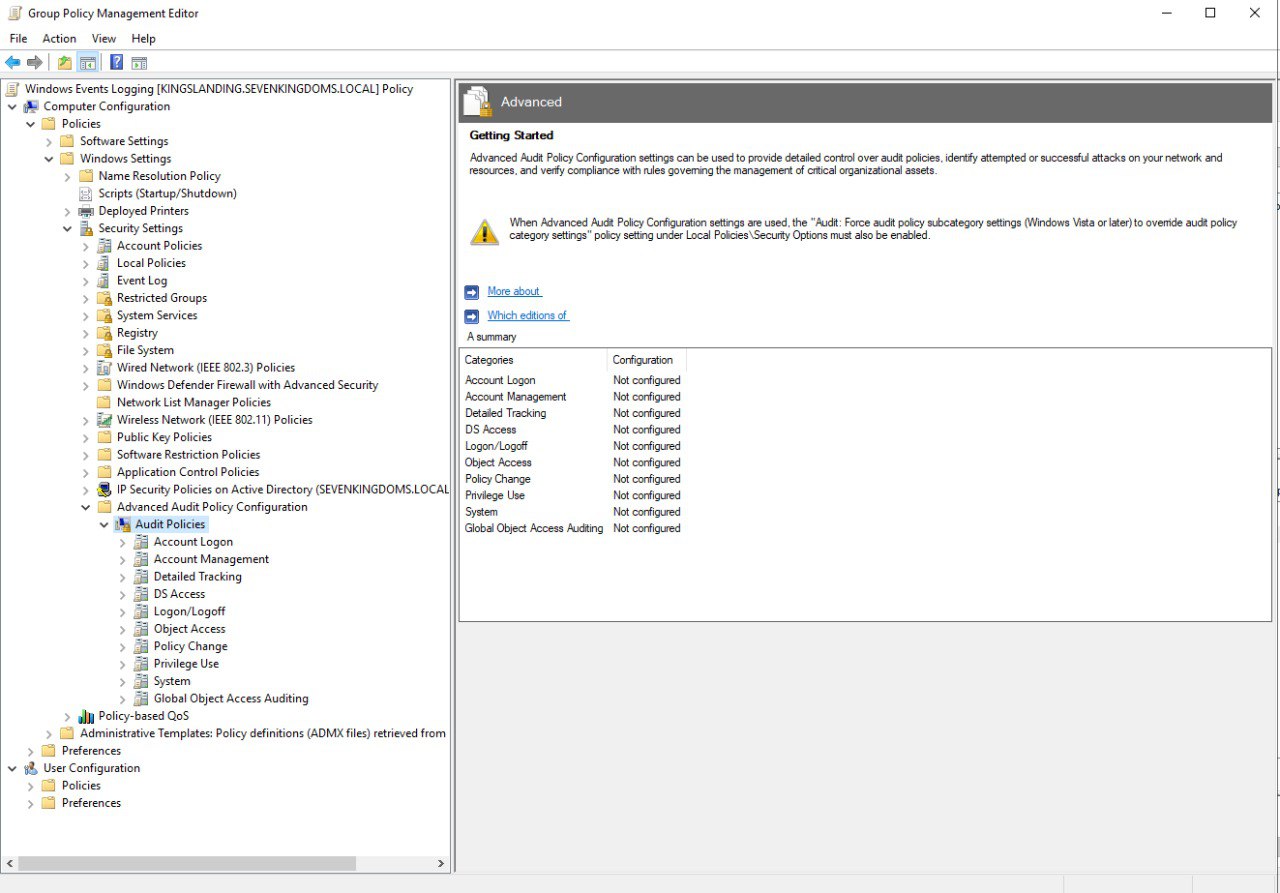
From here on, configure the audit policy according to Microsoft audit recommendation for each subcategory
- After creating the new GPOs, named
Move
Windows Event Loggingpolicy to Forest:sevenkingdoms.local -> Domains -> sevenkingdoms.local -> Domain Controllers to apply it to DC01 - kingslanding and enforce it.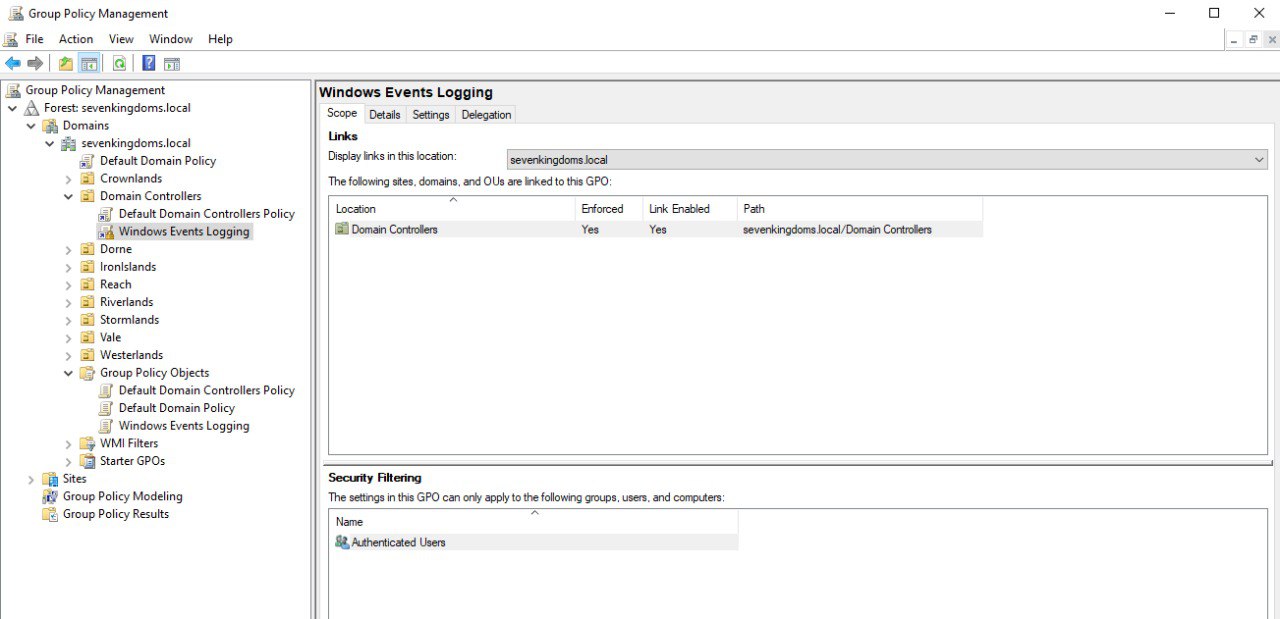
- Verify audit policy settings
- From
Run(Win + R) rungpupdate. This pops a shell updating the Group Policy setting - Open PowerShell as as Administrator and run
audipol /get /category:*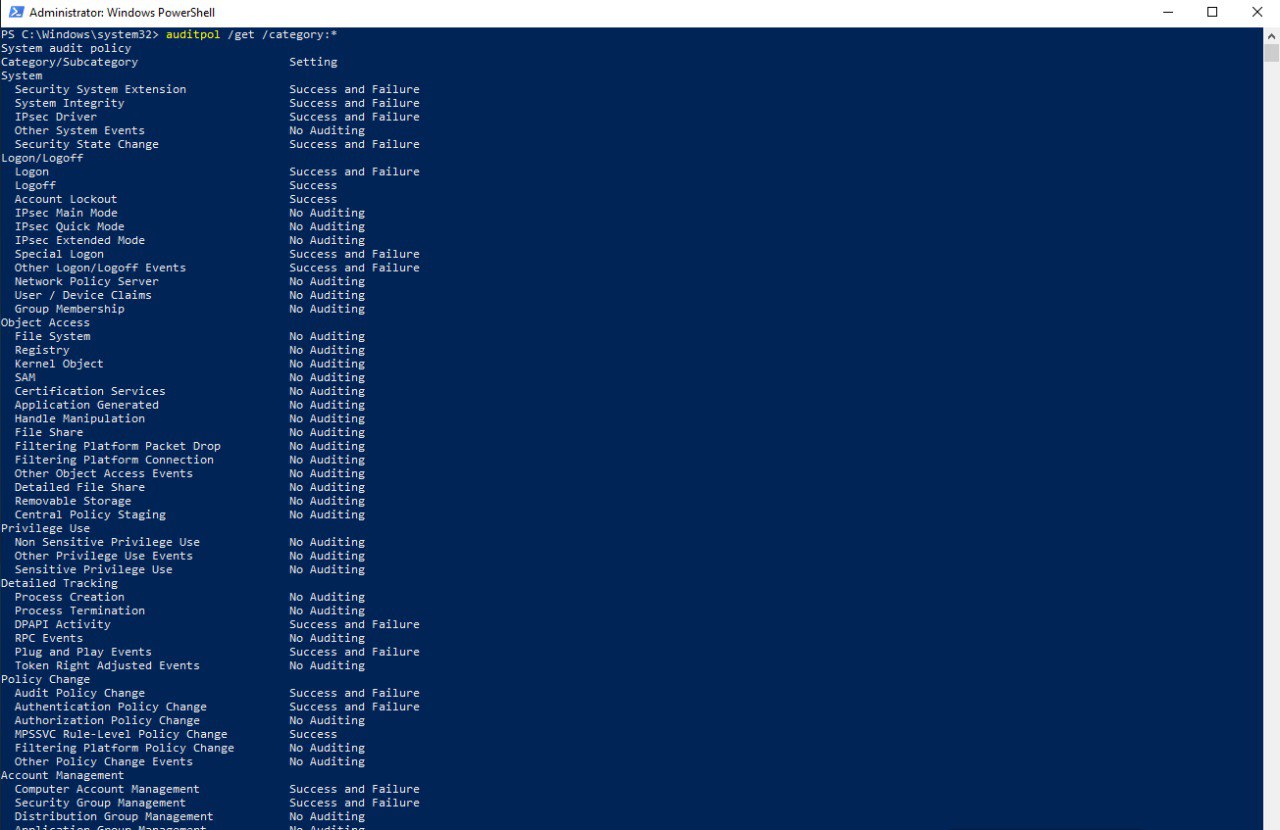
- From
GOAD-Light consists of 2 domains, we will replicate the same audit policy on the domain controller, DC02 - winterfell, in north.sevenkingdoms.local and SRV02 - castelblack
Configuring Sysmon
Sysmon (System Monitor) is part of the Systernal suite. The default Microsoft Windows logging capability is pretty limited, to enhance for higher level monitoring we will install and configure Sysmon. To get the best out of Sysmon itself, we will use the popular Swift On Security configuration.
- Download Sysinternal Suites and Swift On Security Configuration
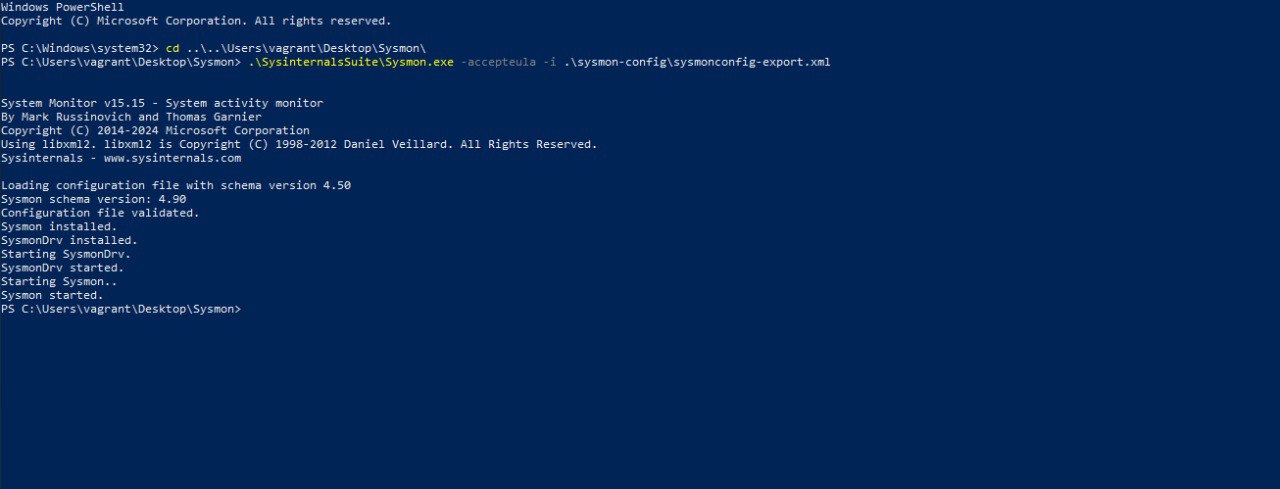
Install and configure with the command
1
 sysmon.exe -accepteula -i sysmonconfig-export.xml
We will replicate the same process on the machines in north.sevenkingdoms.local domain; DC02 - winterfell and SRV02 - castelblack
Windows Event Logs and Winlogbeat
Winlogbeat is installed as a service on a Windows system and serves as a lightweight shipper for sending Windows event logs to Elasticsearch. In this section, I will guide you through the installation and configuration of Winlogbeat within an Active Directory environment.
- Install Winlogbeat
- Download the Winlogbeat zip file from the downloads page.
- Extract the contents into C:\Program Files.
- Rename the winlogbeat-
directory to Winlogbeat. - Open a PowerShell prompt as an Administrator (right-click on the PowerShell icon and select Run As Administrator).
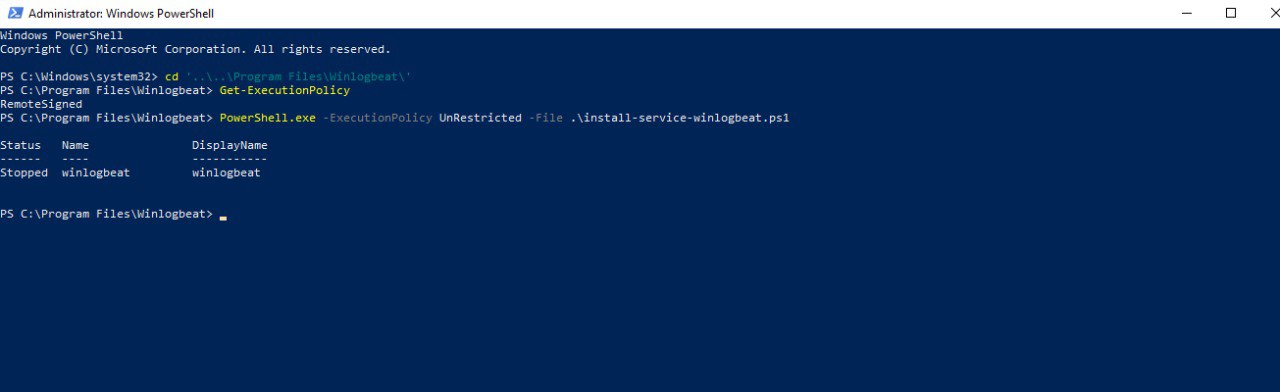
- From the PowerShell prompt, run the following commands to install the service.
1
2
 Get-ExecutionPolicy
 PowerShell.exe -ExecutionPolicy UnRestricted -File .\install-service-winlogbeat.ps1
- Connect to the Elastic Stack
- In order to setup Winlogbeat, we need to connect to Elasticsearch and Kibana. Open the configuration file
winlogbeat.ymlin a text editor and edit theElasticsearchandkibanasections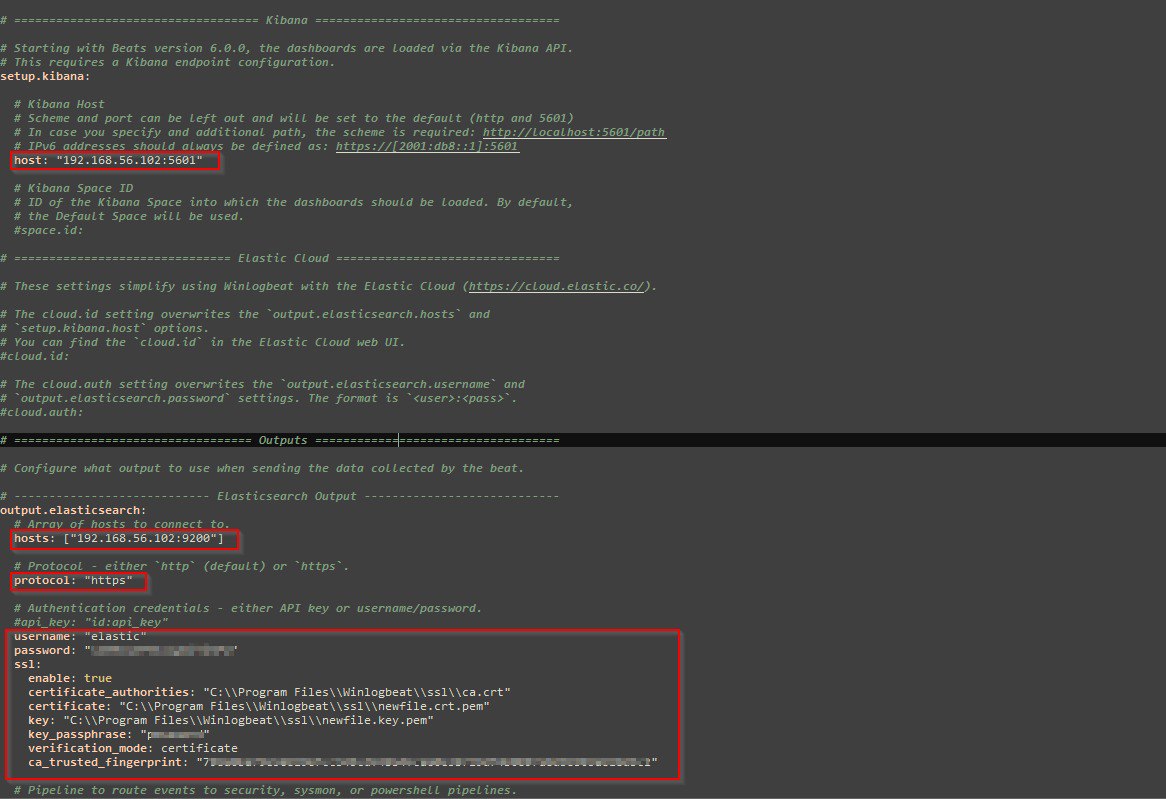
- In order to setup Winlogbeat, we need to connect to Elasticsearch and Kibana. Open the configuration file
- Configure Winlogbeat
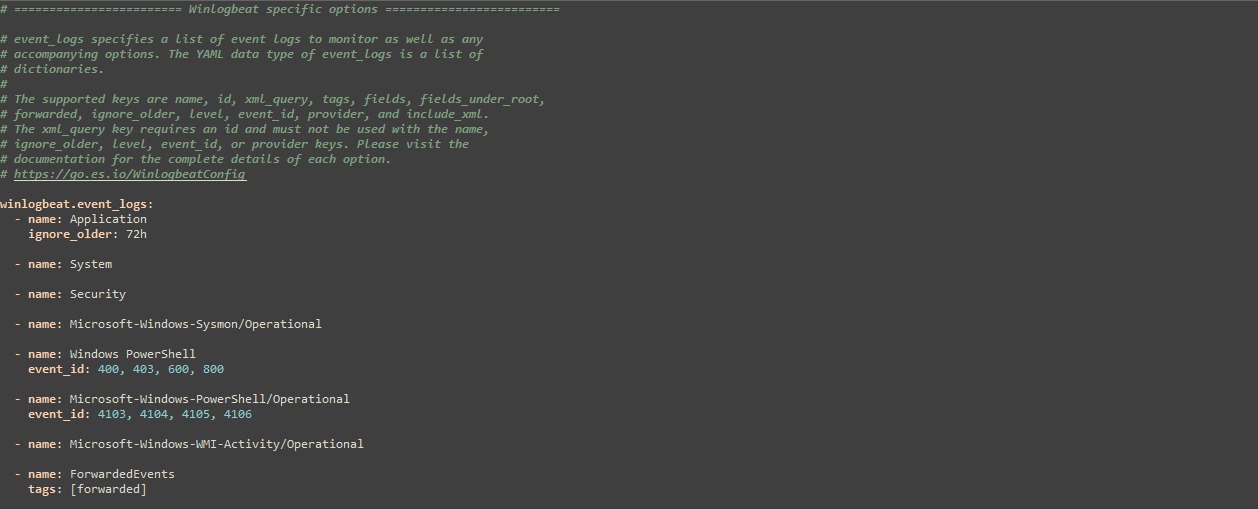
- Under the Winlogbeat specific option, highlight the list of events logs to be monitored.
1
 Get-WinEvent -ListLog * | Measure-Object -Line
The command above returns a total of 410 logs in my case, which is way too much than required. From a security standpoint, we will be interested in the following event logs; Application, System, Security, Windows PowerShell, Microsoft-Windows-PowerShell/Operational, Microsoft-Windows-Sysmon/Operational, and Microsoft-Windows-WMI-Activity/Operational
- Save the
winlogbeat.ymlconfig file and run the command below to test the configuration. At the end, you get aConfig OKmessage1
.\winlogbeat.exe test config -c .\winlogbeat.yml -e
- Under the Winlogbeat specific option, highlight the list of events logs to be monitored.
- Set up Asset
- Run the command below to load the Winlogbeat’s predefined assets for parsing, indexing, and visualizing your data
1
 .\winlogbeat.exe setup -e
At the end, you get a
Loaded Ingest pipelinesmessage
- Run the command below to load the Winlogbeat’s predefined assets for parsing, indexing, and visualizing your data
- Start Winlogbeat
- Get Winlogbeat running with the command:
1
 Start-Service winlogbeat
- You can manage the
winlogbeatservice with Windowsservice.msc
- Get Winlogbeat running with the command:
- Visualize data in Kibana
- Navigate to the Kibana page
http://192[.]168.56.102 - Open Discover from the side navigation and voila!
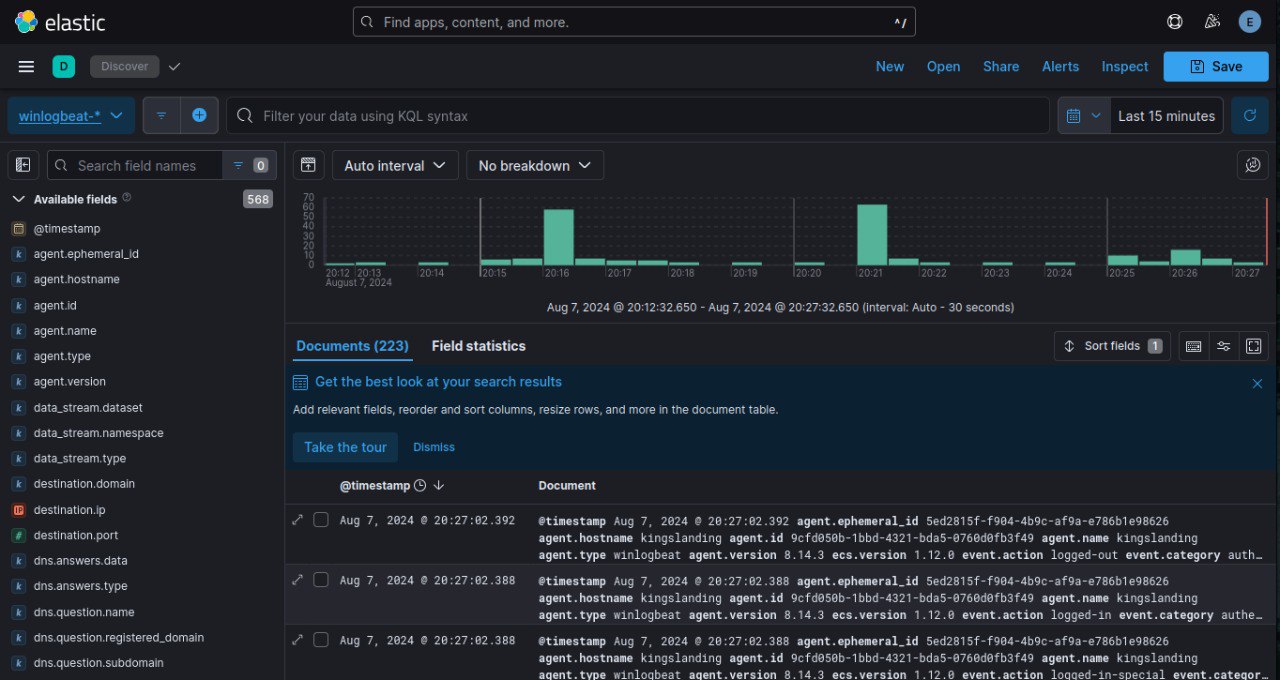
- Navigate to the Kibana page
Troubleshooting
While setting Winlogbeat client configuration options in the output.elastic section, I encountered some issues with the ssl settings. In the previous article’s troubleshooting section, I generated a new CA elastic-stack-ca.p12 and certificate/key elasticsearch-certificates.p12 for Elasticsearch security settings.
The PKCS#12 certificate could not be used in Winlogbeat. So, I converted the PKCS#12 certificate to PEM certificate and private key pairs with the command below:
1
2
openssl pkcs12 -in path.p12 -out newfile.crt.pem -clcerts -nokeys --passin 'pass:<password-here>'
openssl pkcs12 -in path.p12 -out newfile.key.pem -nocerts -nodes --passin 'pass:<password-here>'
Then I used the newfile.crt.pem and newfile.key.pem in the Winlogbeat config file.
Light Out
I would greatly appreciate any feedback on my posts. Feel free to reach out for any reason—questions, comments, or to connect. Happy reading, and let’s keep learning together!