Configuring a SIEM System (ELK Stack)
With a vulnerable Active Directory environment set up, I will proceed to share how to install and configure the ELK Stack as a Security Information and Event Monitoring (SIEM) system. This setup will enable us to centrally collect logs in various formats from endpoints for continuous security monitoring.
As junior security analysts, having a demonstrated understanding of how to identify attack patterns will help you map attackers’ tactics, techniques, and procedures (TTPs).
This blog post is part of my 50-BlueTeam-Projects and a preamble to the Active Directory Exploitation and Security Monitoring series.
Installing Elastic Stack
The following steps highlight how to install the Elastic stack with Debian package:
- Import the Elasticsearch PGP Key
- Download and install the public signing key:
1
wget -qO - https://artifacts.elastic.co/GPG-KEY-elasticsearch | sudo gpg --dearmor -o /usr/share/keyrings/elasticsearch-keyring.gpg
- Download and install the public signing key:
- Installing from the APT repository
- Install the apt-transport-https package:
1
sudo apt-get install apt-transport-https
- Save the repository definition to /etc/apt/sources.list.d/elastic-8.x.list:
1
echo "deb [signed-by=/usr/share/keyrings/elasticsearch-keyring.gpg] https://artifacts.elastic.co/packages/8.x/apt stable main" | sudo tee /etc/apt/sources.list.d/elastic-8.x.list
- Install the apt-transport-https package:
- Install Elasticsearch, Logstash, Kibana
1
sudo apt-get update && sudo apt-get install elasticsearch logstash kibana
Toward the end of the installation, take note of the security information displayed on the terminal. There will be a password generated for the built-in superuser.
The next section outlines the configuration of each component of the stack
Configuring Elastic Stack
After successful installation, the first step is to enable the services to start automatically using systemd:
1
2
3
4
sudo systemctl daemon-reload
sudo systemctl enable elasticsearch.service
sudo systemctl enable logstash.service
sudo systemctl enable kibana.service
Configuring Elasticsearch
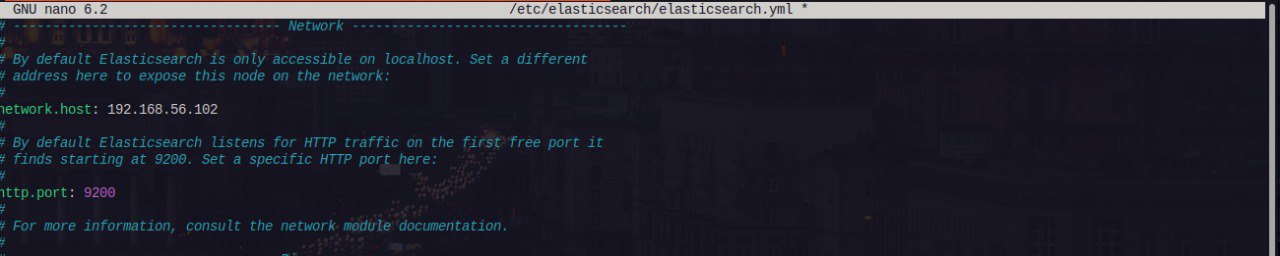
- The configuration is quite easy, locate the config file at
/etc/elasticsearch/elasticsearch.ymland configure theNetwork Section accordingly
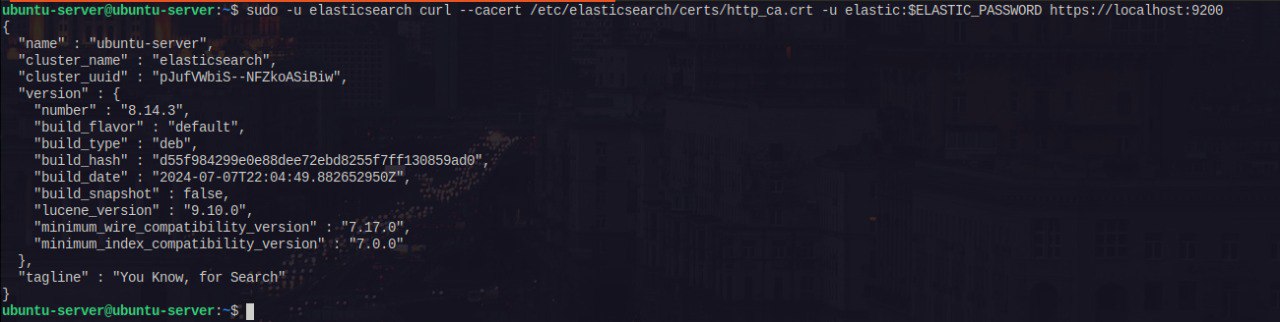
- Check that Elasticsearch is running:
1
sudo -u elasticsearch curl --cacert /etc/elasticsearch/certs/http_ca.crt -u elastic:$ELASTIC_PASSWORD https://localhost:9200
Configuring Logstash
According to the documentation, Logstash requires one of these versions:
- Java 11
- Java 17 (Default)
- Install Java 17 using OpenJDK distribution
1
sudo apt install openjdk-17-jre
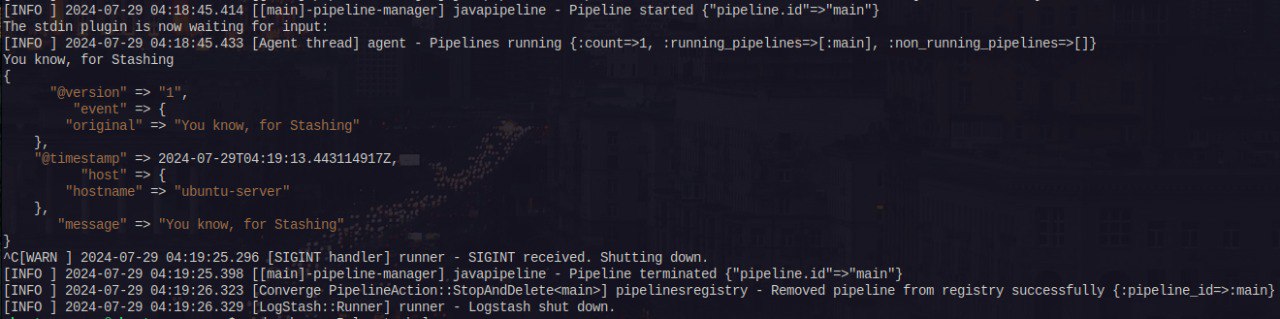
- Test Logstash installation, run the most basic Logstash pipeline.
1
/usr/share/logstash/bin/logstash -e 'input { stdin { } } output { stdout {} }'
Logstash is quite a robust data collection engine. I will write extensively on it in a future blog.
Configuring Kibana
Kibana is the frontend to the Elastic stack. The Kibana configuration file is located at /etc/kibana/kibana.yml.
- Edit the Configuration File
Edit the
server.portandserver.hostaccording as shown below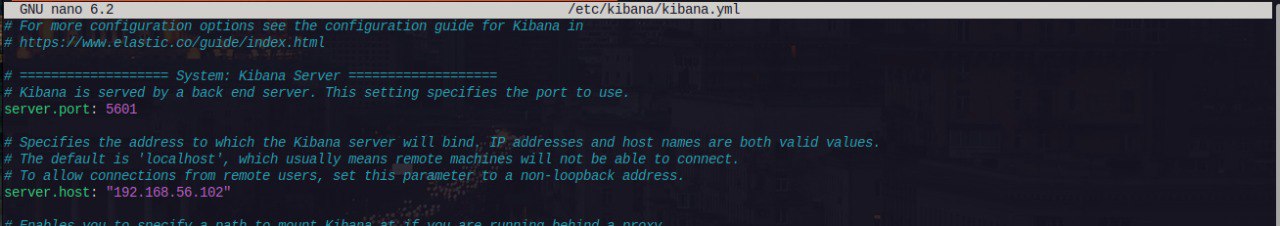
- Restart the Kibana Service
1
sudo systemctl restart kibana.service
Access Kibana
- Navigate to the Kibana address specified in the configuration file. In this example:
hxxp://192[.]168.56.102:5601 Begin the configuration process:
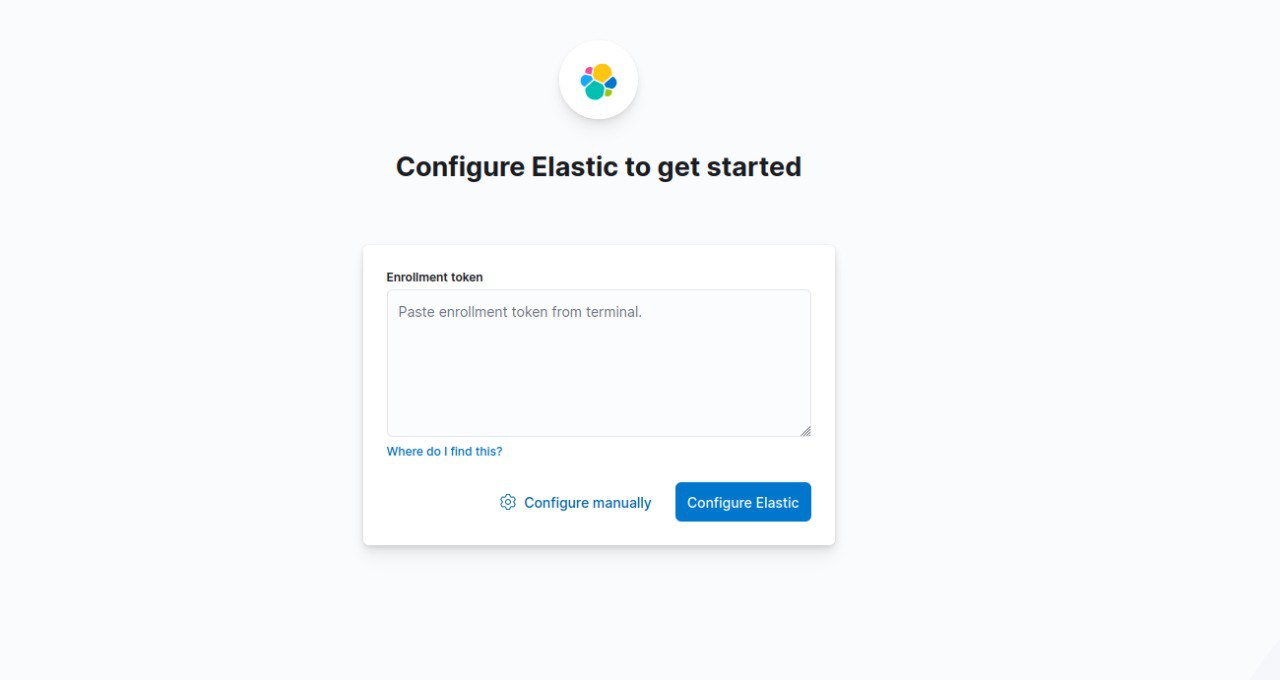
- Navigate to the Kibana address specified in the configuration file. In this example:
- Login
After the initial configuration, you will be prompted for a login and password. Use your
elasticuser and the generated password: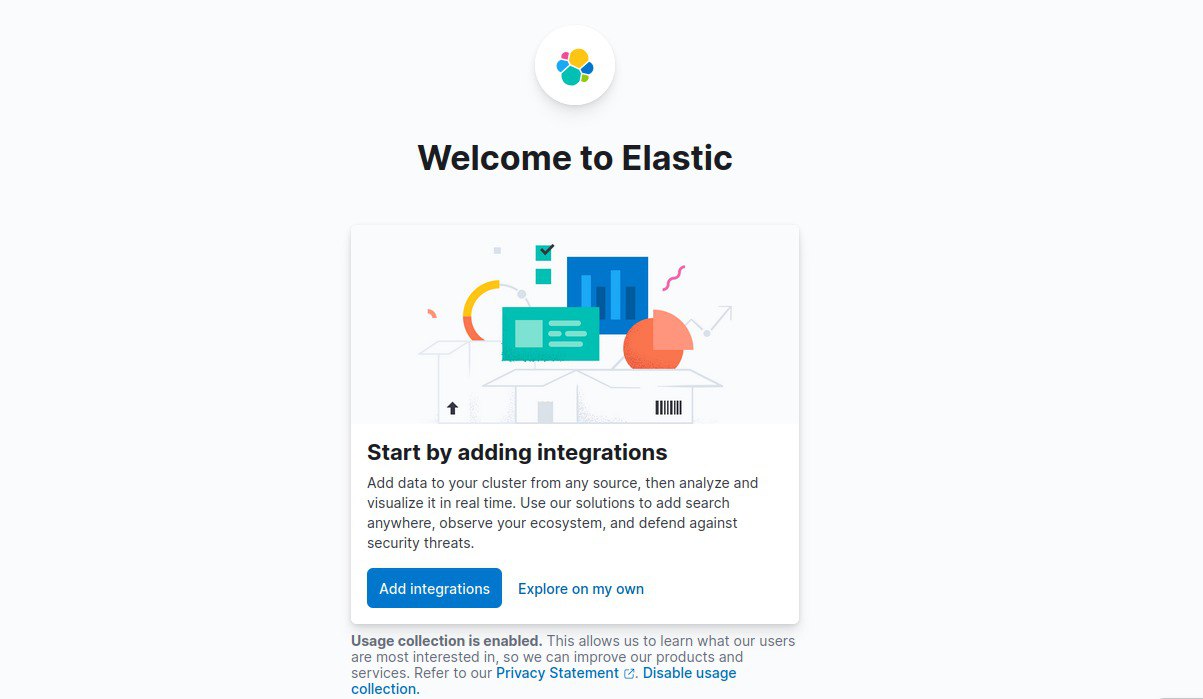
That completes the setup of the Elastic stack
Troubleshooting
After the installation I configured the ELK Stack in the same airgapped environment as the machines in the GOAD lab setup.
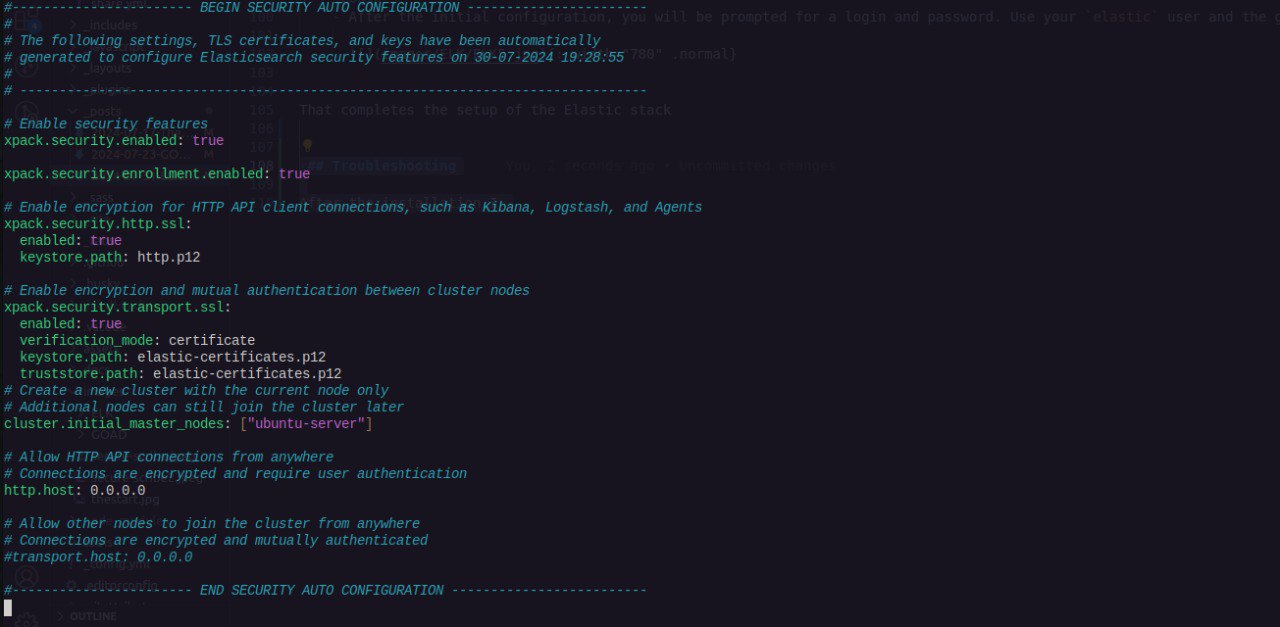
Security feature is enable by default when you installed Elasticsearch. To override the default security configuration, I generated a new Certificate Authority and a new HTTPS configuration.
The guides to the both steps are below:
I updated the elasticsearch.yml file according as shown below:
Light Out
I would greatly appreciate any feedback on my posts. Feel free to reach out for any reason—questions, comments, or to connect. Happy reading, and let’s keep learning together!