Network Security Monitoring with Suricata

Suricata as an open-source network threat detection engine stands out for its versatility and power. Primarily known for its use as an IDS/IPS, Suricata also offers a number of features which include logging capabilities for application layer protocols (TLS/SSL, HTTP, DNS), scripting, pcap recording, and file extraction.
This blog will guide you through the process of setting up and configuring Suricata for network security monitoring. I’ll cover everything from installation to writing custom rules, testing your setup, and integrating Suricata logs into an ELK SIEM for comprehensive analysis.
Installation
For Ubuntu, Open Information Security Foundation (OISF) maintains the suricata-stable PPA, which is regularly updated with the latest stable release of Suricata.
- Setup to install the latest stable Suricata:
1
2
3
sudo apt-get install software-properties-common
sudo add-apt-repository ppa:oisf/suricata-stable
sudo apt-get update
- Then, you can install the latest stable with:
1
sudo apt-get install suricata
- To check the installed version, use the command:
1
suricata -V
Now, we will proceed to the setup section
Setup
- Before proceeding with the setup, get the network interface(s) and IP address(es) on which Suricata should inspect packets
1
ip -br a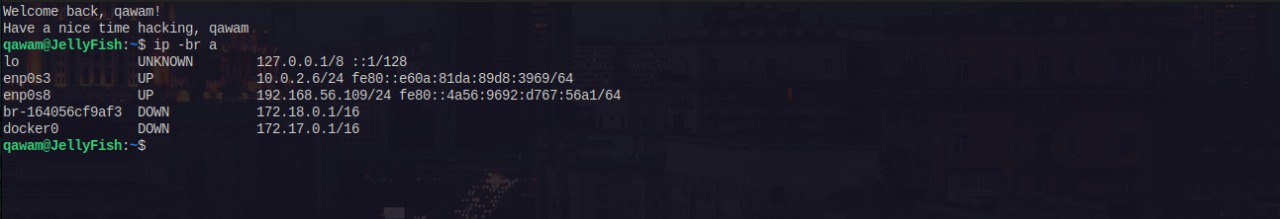
- With that information, configure Suricata using the
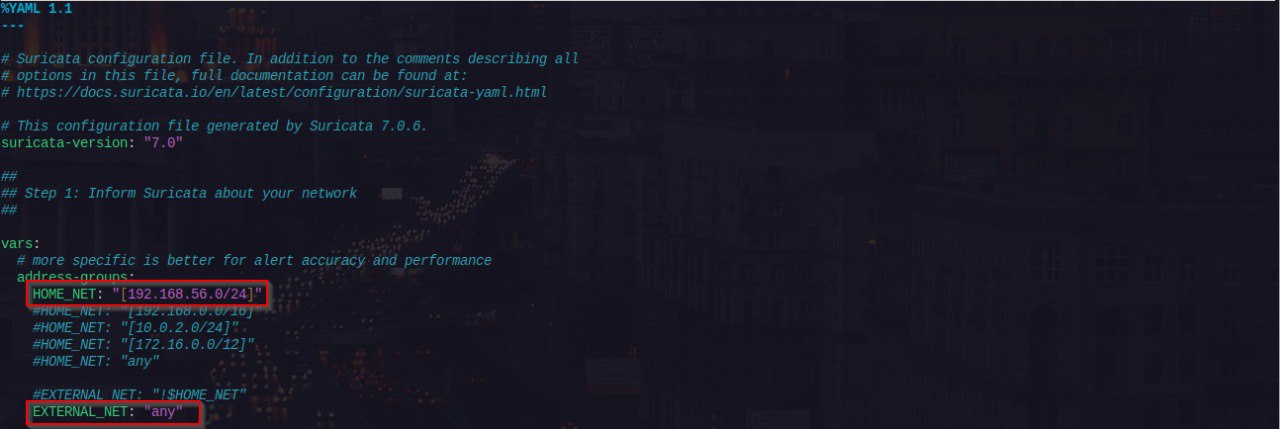
suricata.yamlconfig file.Inform Suricata about your network
The#HOME_NET:variable represent the network segment of your LAN while the#EXTERNAL_NETis set to any because this is an airgapped environment and traffic will be within the LAN.
Select outputs to enable
If there is no need to change logging settings, leave as default.Configure common capture settings
Underaf-packet, specify the interface name of the#HOME_NETspecified earlier, leave rest as default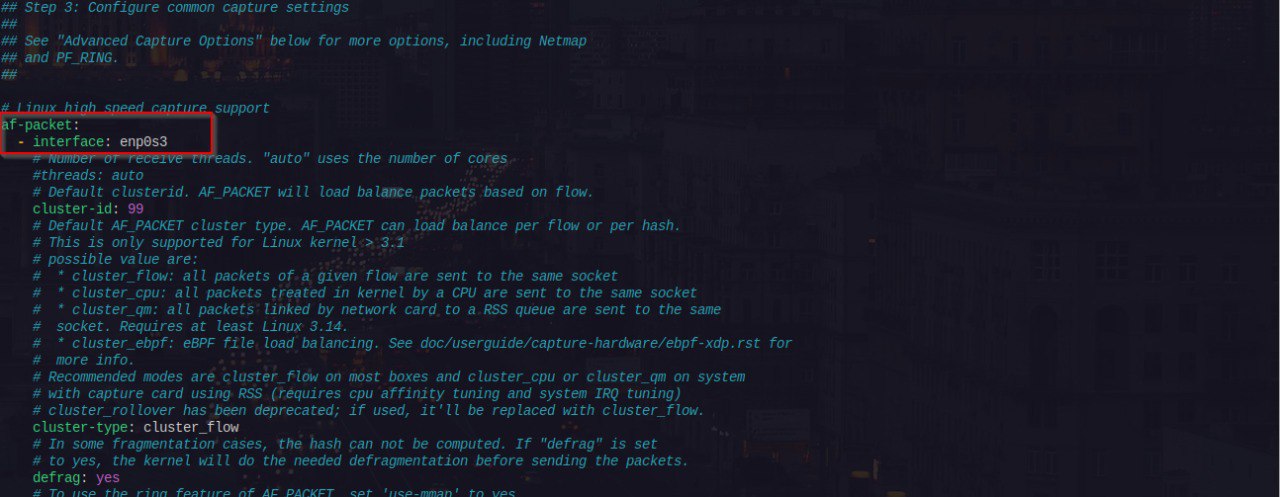
This complete the basic configuration for Suricata in IDS runmode. Next up is Signatures (Rules)
Signatures (Rules)
Suricata signatures, commonly referred to as rules, are used for triggering alerts. It is necessary to keep them updated always. The suricata-update tool simplifies the process of fetching, updating, and managing rules for Suricata.
There are several aspects to rule management, including updating existing rules, incorporating additional rulesets, selecting which rules to activate, and creating custom rules. For this setup, we’ll focus on the default configuration, which uses the Emerging Threats (ET) Open ruleset.
1
sudo suricata-update
To test our configuration in this airgapped environment, I’ll demonstrate by creating a simple custom rule to detect ICMP traffic within the network. The following steps outline how to add your own rules:
- Create a file for local rules
local.rulesin any directory1 2
cd /var/lib/suricata/rules sudo touch local.rules
Update the config file to include the
local.rulesfile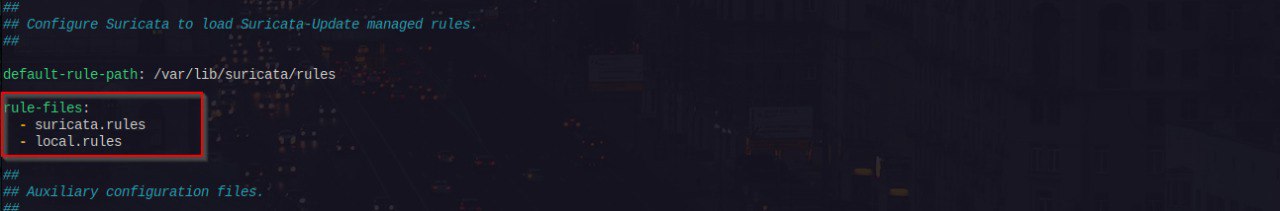
- The custom rule is shown below
1
alert icmp $HOME_NET any <> $EXTERNAL_NET any (msg: "ICMP Test Rule"; sid: 1; rev: 1;)
- This rule can be triggered quite easy. Start tail to see updates to fast.log and ping any system on the network
1
sudo tail -f /var/log/suricata/fast.log
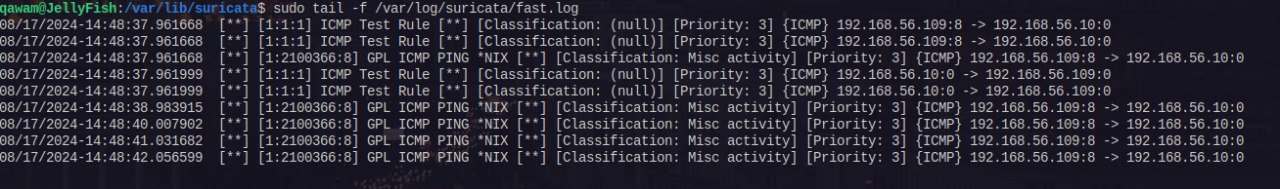 I had no clue there was an existing rule to match ping (GPL ICMP PING *NIX)
 - Test configuration
1
sudo suricata -T
The next step in this blog post is to integrate Suricata with our Elastic Stack setup, enabling centralized log management.
Integrating Suricata with ELK Stack
To get the best out of Suricata, the next step is to integrate it with our ELK Stack setup. This integration will allow us to centralize and analyze logs from Suricata within Elasticsearch, providing a unified view of network events. By feeding Suricata’s alerts and logs into Kibana, we can visualize and investigate potential threats more efficiently, turning raw data into actionable insights.
The components for this setup:
- Elasticsearch
- Kibana
- Filebeat
- Suricata
Filebeat Installation and Configuration
Installing Filebeat
Using Elastsic APT repositories, we begin the installation of Filebeat with the following:
- Add the Beats repository for APT
- Download and install the Public Signing Key:
1
 wget -qO - https://artifacts.elastic.co/GPG-KEY-elasticsearch | sudo apt-key add -
- Install the apt-transport-https package on Debian:
1
 sudo apt-get install apt-transport-https
- Save the repository definition to /etc/apt/sources.list.d/elastic-8.x.list:
1
 echo "deb https://artifacts.elastic.co/packages/8.x/apt stable main" | sudo tee -a /etc/apt/sources.list.d/elastic-8.x.list
- Download and install the Public Signing Key:
- Install with apt-get
- Update the repositories and install with apt package manager
1
 sudo apt-get update && sudo apt-get install filebeat
- Update the repositories and install with apt package manager
Configuring Filebeat
With Filebeat successfully installed, the next step is to configure it and enable the Suricata module. This module will allow us to seamlessly ship Suricata’s eve.json logs to Elasticsearch, where we can then visualize the data in Kibana.
- Configure Suricata module
- The recommended way is to configure modules in the
modules.ddirectory.1
sudo filebeat modules enable suricata
- Then open the
/etc/filebeat/modules.d/suricata.ymlfile and seteve.enable:totrue
- The recommended way is to configure modules in the
- Configure Filebeat
Open the
filebeat.ymlconfig file, configureKibana outputandElastic outputsections accordingly as shown below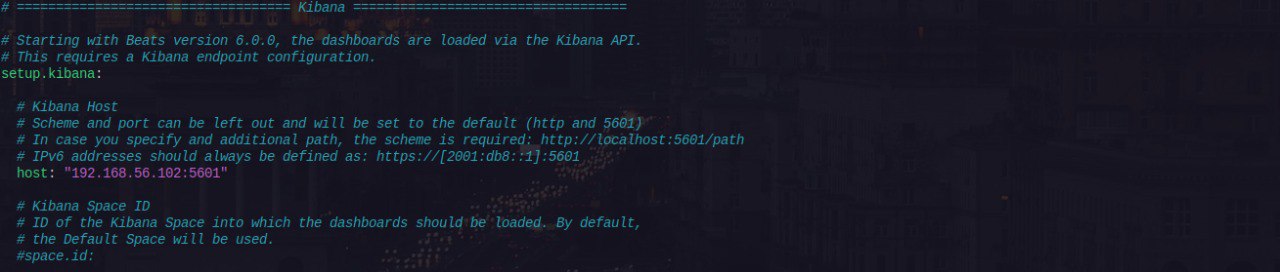 Kibana Output
 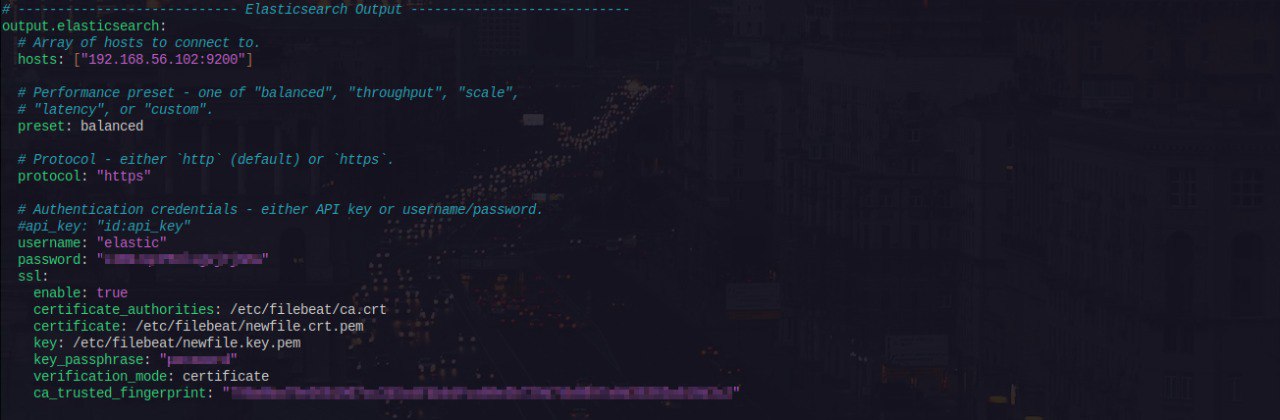 Elasticsearch Output
- Save the config file and run the command below to test the configuration. At the end, you get a
Config OKmessage1
sudo filebeat test config
- Run the command below to load the Winlogbeat’s predefined assets for parsing, indexing, and visualizing your data
1
 sudo filebeat setup -e
At the end, you get a
Loaded Ingest pipelinesmessage - Start
filebeat.servicewithsystemd1
sudo sysetmctl start filebeat.service
- Visualizing Suricata Data in Kibana
- Navigate to the Kibana address and open Dashboards to visualize Suricata data
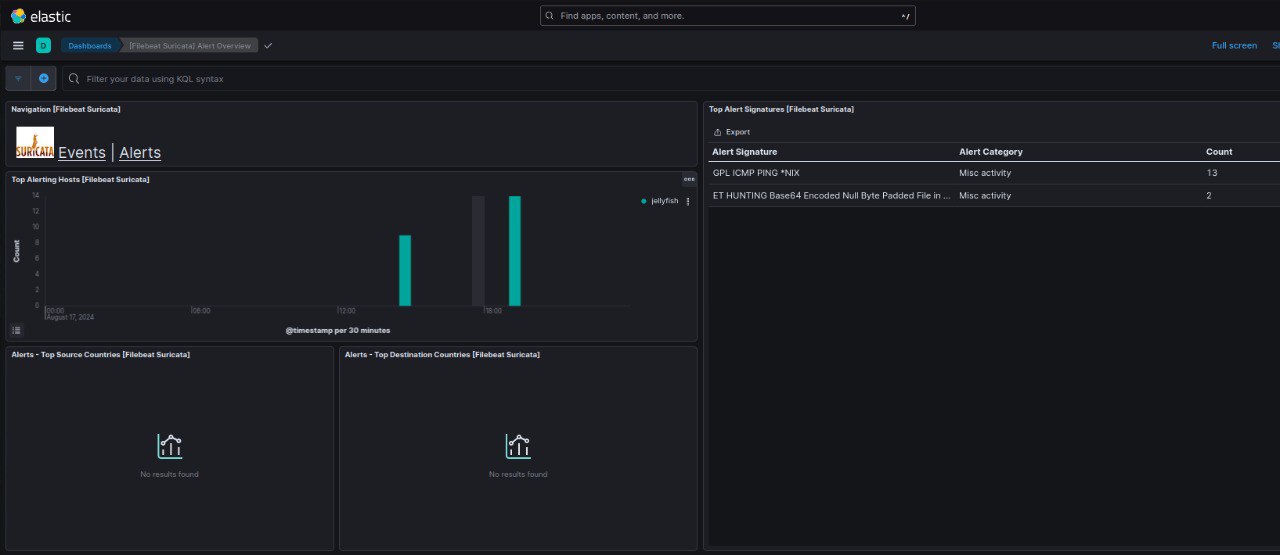 Not so much going on yet ;)
- Navigate to the Kibana address and open Dashboards to visualize Suricata data
Light Out
I would greatly appreciate any feedback on my posts. Feel free to reach out for any reason—questions, comments, or to connect. Happy reading, and let’s keep learning together!